Hong Kong tops rankings in Global House Price Index Q1 2018
Contact
Hong Kong tops rankings in Global House Price Index Q1 2018
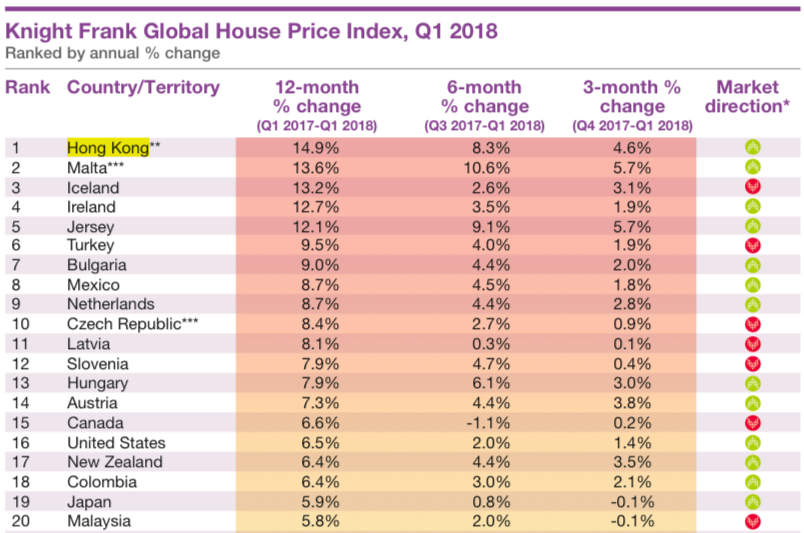
Knight Frank's Global House Price Index Q1 2018 reveals Hong Kong has ranked number one for the 11th time since Index began in 2008.
Results from Knight Franks latest Global House Price Index for Q1 2018 reveal that Hong Kong has come out on top once for the first time since Q2 2015 with average prices ending 14.9% higher. Since Knight Frank's Index began in 2008, Hong Kong has held the top spot on ten separate occasions - more than any other territory tracked.
Global House Price Index Q1 2018 at a glance:
- The Knight Frank Global House Price Index increased by 4.8% in the year to March 2018
- House prices are rising in 86% of the 57 countries tracked by our index
- Hong Kong leads the index for the first time since the second quarter of 2015
- Only 9% of the markets tracked registered price growth above 10%, down from 18% a year ago
- North America (6.6%) remains the strongest-performing world region, followed by Asia Pacific at 5.7%
Despite an improving supply scenario over the long-term – 96,000 apartments are due to be released in the next three to four years – and the likelihood of a prime rate rise, prices in Hong Kong continue to accelerate with small to medium-sized units recording the strongest price growth.

Source: Knight Frank Global House Price Index Q1 2018
The Mediterranean island of Malta occupies second spot (13.6%) in our rankings, while Iceland (13.2%), Ireland (12.7%) and Jersey (12.1%) complete the top five.
'In Ireland’s case, its burgeoning economy explains its strong performance. Ireland has been Europe’s fastest-growing economy for four consecutive years, with GDP growth estimated to have reached 7.8% in 2017. Despite rising by 12.7% in the year to March, residential prices in Ireland remain 21% below their peak in Q1 2007.
As indicated in Knight Franks previous edition, Europe’s recovery is now well-underway, closer analysis confirms 11 of the 15 strongest-performing housing markets globally were in Europe at the end of March 2018.
What is clear is the extent to which the outliers are disappearing with the performance of countries and territories now converging. A year ago 18% of markets recorded annual price growth above 10%, in Q1 2018 this figure has fallen to 9% (figure 3). This may be an indication that buyer sentiment is weakening, as the shift towards tighter monetary policy and the removal of stimulus becomes a reality in key global economies.
Ahead of the G7 summit, we assess average price change for each member state and the rise in base points since the last G7 summit a year ago (figure 4). Canada and the US, the two markets that have registered the strongest rise in prices, have also seen their base rate rise by 0.75 basis points over this time.
Analysis by world region shows:
- North America (6.6%) remains on top (based on a simple non-weighted average)
- Asia Pacific (5.7%)
- Europe (5.3%)
- Middle East (3.5%)
- Latin America (3%)
- Africa (0.5%)
Click here to view Knight Franks Global House Price Index Q1 2018.
For more information about Knight Franks Global House Price Index phone or email Kate Everett-Allen or Liam Bailey of Knight Frank via the contact details listed below.
Similar to this:
Tokyo overtakes London as world's busiest real estate market
Vietnam economic overview bodes well for 2018 - Colliers reports
Wellness now a key business priority for APAC companies in future


